Introduction to Data Visualization: Student Projects
A compilation of final projects completed by students in the Fall 2014 data visualization course at the UC Berkeley Graduate School of Journalism. Instructor: Peter Aldhous; thanks also to J-School lecturer Jeremy Rue for help and advice to students.
Jason Paladino

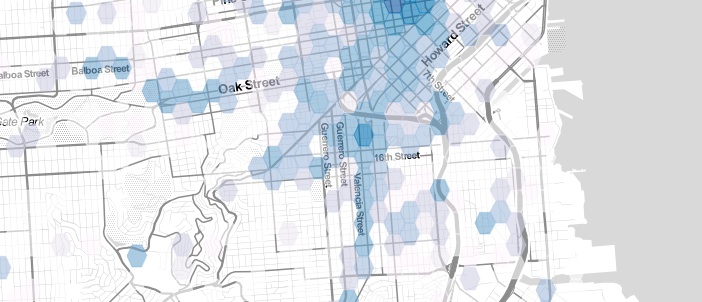
Gunfire in Oakland
I mapped gunshots detected by the Shotspotter detection system and calls from the public reporting gunfire.
Sources: Oakland Police Department and OpenOakland.
View ProjectChris Schodt
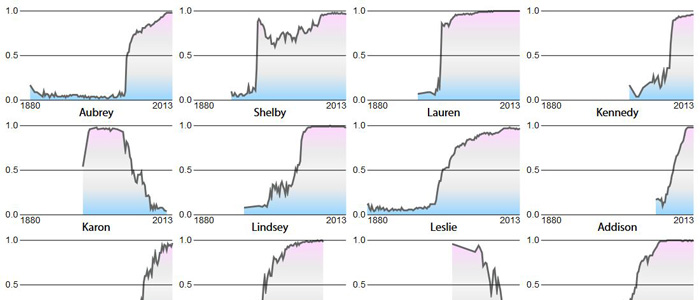
Gender-Shifted Names
Graphics showing the relative distribution over time of the 100 names with the biggest shifts between men and women.
Source: Social Security Administration.
View ProjectJake Nicol
Exploring the impact of the proposed Nicaragua Canal
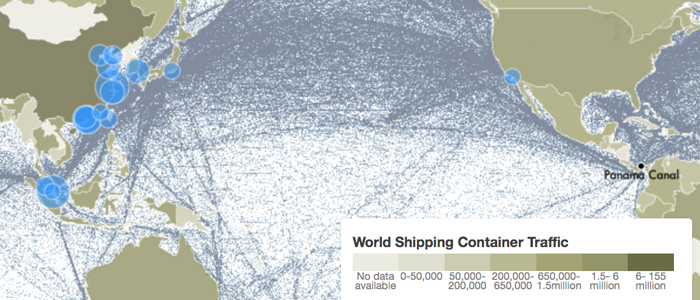
World Shipping Container Traffic
Interactive map: Circles show the top 20 ports worldwide, scaled by volume of container traffic; tracks show shipping voyages in 2007.
Sources: World Bank, World Shipping Council, National Center for Ecological Analysis and Synthesis.
View Project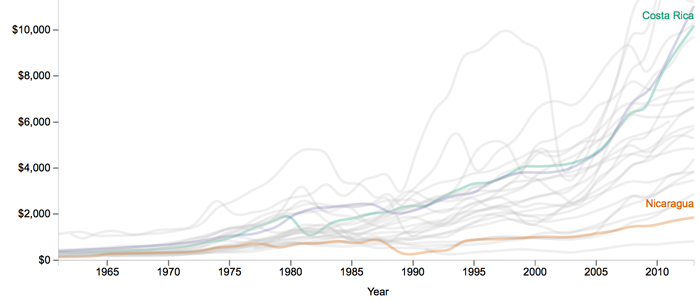
GDP Per Capita in Latin America and the Caribbean
Line graph comparing how Nicaragua fares against its closest neighbors in economic development over the years.
Source: World Bank.
View Project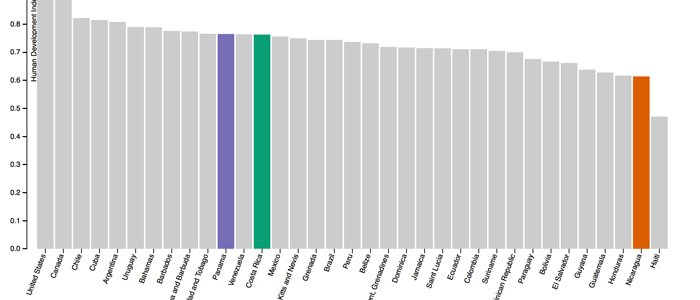
Human Development Index for Western Hemisphere Countries in 2013
Bar chart comparing the Human Development Index of countries in the Western Hemisphere. Nicaragua has the second lowest.
Source: United Nations Development Programme.
View ProjectCaterina Visco
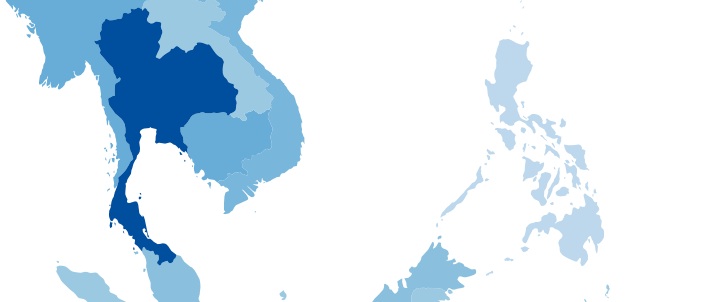
HIV in Southeast Asia
In 1992, 699,000 people in the region were infected with HIV; by 2011 there were 4 million. This is a portrait of the epidemic and responses to it.
Source: UNAIDS.
View ProjectJuan Martinez
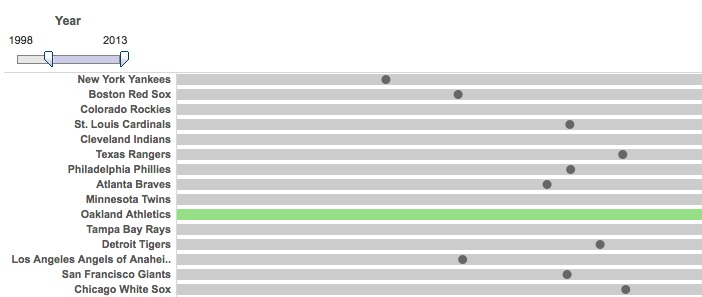
The Oakland A’s Moneyball Success
Since Billy Beane became the A’s general manager in 1998, he has turned the club into a perennial playoff team despite a low payroll budget.
Sources: Lahman’s Baseball Database, MLB.com and Baseball-reference.com.
View ProjectJoaquin Palomino
Crime in the Heart of San Francisco
While San Francisco’s crime rates ebb and flow from year to year, their locations remain more or less the same.
Source: San Francisco Police Department.
View ProjectAndy Mannix
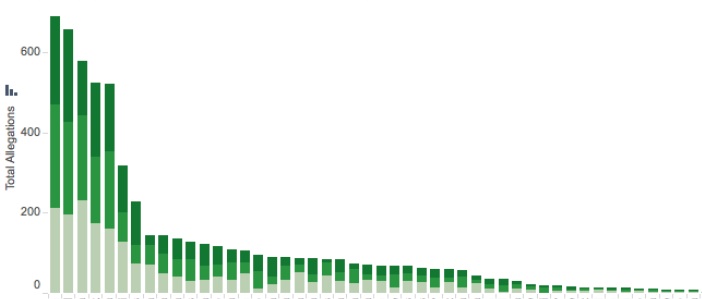
Staff Sexual Misconduct in Washington Prisons
Washington state ranks highest in the nation for reported allegations against prison staff, both in total and per 1,000 inmates.
Sources: U.S. Department of Justice and Washington Department of Corrections.
View ProjectXavier Malina
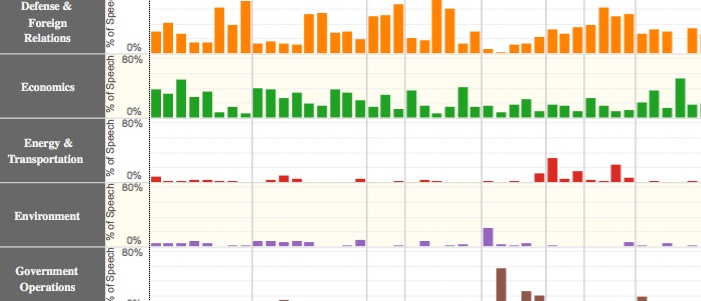
Dissecting the State of the Union
An exploration of the topics covered and the sentiments expressed in the annual presidential address to Congress and the nation.
Source: Policy Agendas Project.
View ProjectShubham Goel
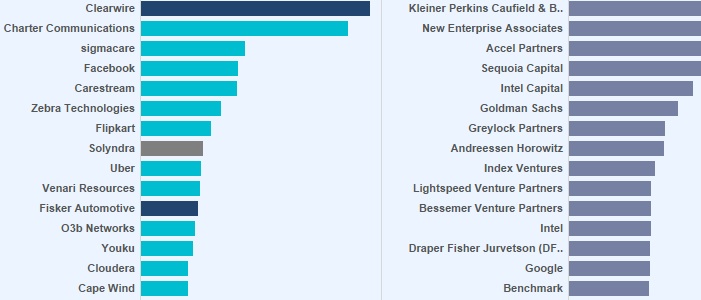
Startup Investments
Which venture capitalists backed which startups, and with how much cash? Explore with this visualization.
Source: CrunchBase.
View Project