Final project
Exploring the impact of the proposed Nicaragua Canal
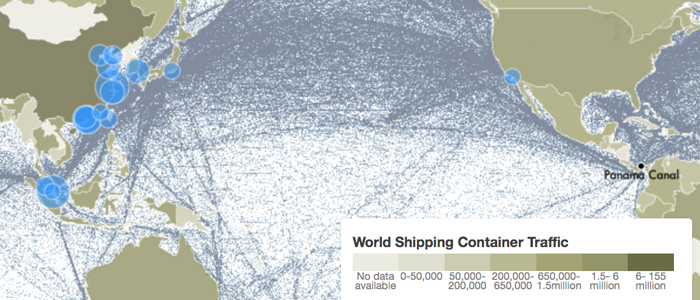
World Shipping Container Traffic
Interactive map shows the flow of containers from land to sea and vice versa. Circles show the top 20 ports worldwide, scaled by volume of container traffic. Lines show global shipping voyages for 2007.
Sources: World Bank, World Shipping Council, National Center for Ecological Analysis and Synthesis
View Project
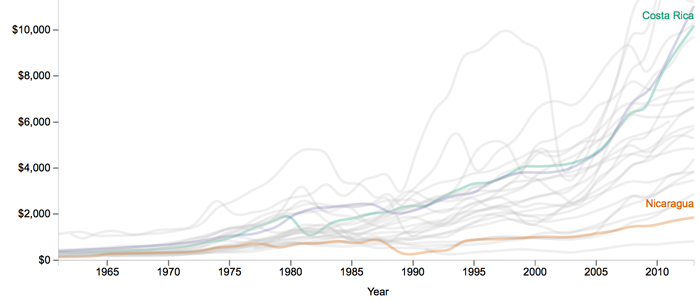
GDP Per Capita in Latin America and Caribbean
D3 Line graph comparing how Nicaragua fares against its closest neighbors in economic development over the years.
Source: World Bank
View Project
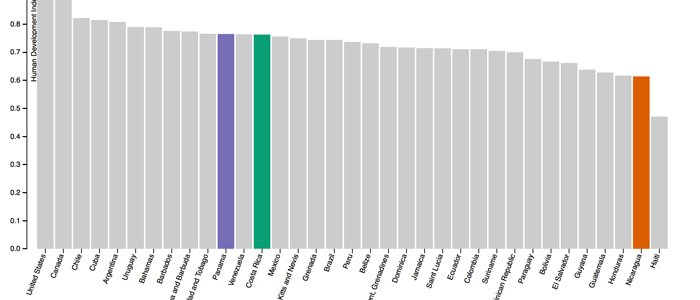
Human Development Index for Western Hemisphere Countries in 2013
D3 bar chart comparing the Human Development Index of countries in the Western hemisphere. Nicaragua is the second lowest before Haiti.
Source: United Nations Development Programme
View Project
Tableau Public assignment
Economic Growth and Life Expectancy in BRICS Countries
World Shipping Container Traffic
Interactive map shows the flow of containers from land to sea and vice versa. Circles show the top 20 ports worldwide, scaled by volume of container traffic. Lines show global shipping voyages for 2007.
Sources: World Bank, World Shipping Council, National Center for Ecological Analysis and Synthesis
View ProjectGDP Per Capita in Latin America and Caribbean
D3 Line graph comparing how Nicaragua fares against its closest neighbors in economic development over the years.
Source: World Bank
View ProjectHuman Development Index for Western Hemisphere Countries in 2013
D3 bar chart comparing the Human Development Index of countries in the Western hemisphere. Nicaragua is the second lowest before Haiti.
Source: United Nations Development Programme
View ProjectThe 5 BRCIS countries (Brazil, Russia, China, India, and South Africa) are commonly linked as emerging economies at the same stages of newly advanced economic development. Yet they have taken five distinct routes to their current position and find themselves at five unique points in terms of their Gross Domestic Product (GDP) per capita, life expectancy at birth, and infant mortality rates.
The goal for the development of each country is to move as far into upper right quadrant of the chart as possible, increasing GDP per capita and life expectancy, while reducing infant mortality. The smaller the circle, the lower the rate of infant mortality. Each country’s plot starts in 1990 and ends in 2012.


