Final project
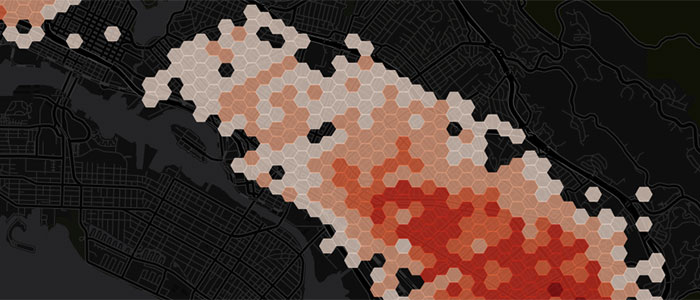
Gunshots in Oakland
Using data obtained from Oakland Police Department, I mapped gunshots detected by the Shotspotter detection system and calls reporting gunfire.
View ProjectTableau Public assignment
The BRICS nation's battle for longer lives and healthier economies
The following graphs show the relation between GDP per capita and life expectancy, along with infant mortality. The ultimate goal is to be in the upper right corner of the graph, meaning GDP per capita and life expectancy are highest. It is also best to have the smallest circles possible, indicating a low infant mortality rate.
